Apply a uniform color scheme to dna_segs and comparisons
uniform_color_scheme.RdGenerates and applies a uniform color scheme to a list of dna_seg and/ or
comparison objects. This is done by generating a set of colors based
on a set of unique values taken from a given (shared) column.
Usage
uniform_color_scheme(
  dna_segs = NULL,
  comparisons = NULL,
  id_column,
  ids = NULL,
  cluster_ids = TRUE,
  colors = NULL,
  color_var = "fill",
  alpha_dna_segs = NULL,
  alpha_comparisons = NULL
)
Arguments
- dna_segs
A list of
dna_segobjects.- comparisons
A list of
comparisonobjects.- id_column
The name of a column, whose unique values will be used to generate a color scheme. Must exist in all provided data sets.
- ids
A character vector of values from the
id_columnto generate colors for. Any values found in theid_columnthat are not in this set will be ignored.- cluster_ids
Logical. If
TRUE, numbered values may be clustered together, sharing a single color. Specifically, it will look for values that end in a number, and when these values are the same once the number is removed, it will cluster them together. For example:"lac_1","lac-2", and"lac"will all be given the same color. Finally, the value"-"(which is usually the value in thegenecolumn for hypothetical proteins) will also be given its own dedicated color.- colors
Choice of colors to use, can be a palette, or a vector of colors. See details.
- color_var
A character string denoting which color attribute to update for the
dna_segs, one of:"fill","col".- alpha_dna_segs
A single numeric value between 0 and 1, or
NULL. Determines the transparency applied to the colors used for thedna_segs, 0 being fully transparent, and 1 being fully opaque.- alpha_comparisons
A single numeric value between 0 and 1, or
NULL. Determines the transparency applied to the colors used for thecomparisons, 0 being fully transparent, and 1 being fully opaque.
Value
If only dna_segs is provided, a list of dna_seg objects.
If only comparisons is provided, a list of comparison
objects.
If both dna_segs and comparisons are provided, a list with 2
named elements: dna_segs and comparisons, which are both lists containing
the dna_seg and comparison objects, respectively.
Details
The amount of colors generated is equal to the amount of unique values
present in the id_column in the data set(s).
The colors argument can be
left as NULL, in which case one of 3 different palettes will be used, based
on the amount of colors that need to be generated. If not NULL, then
colors must be either a character string representing a known palette
(see hcl.pals and palette.pals), or a character vector with values
that can be recognized as colors (i.e. "red" or "#88CCEE"). If there are
not enough colors in this vector, then they will be duplicated and a warning
will be given.
Examples
## Prepare dna_seg
names1 <- c("A", "B", "C")
names2 <- c("A", "C", "B")
names3 <- c("B", "A", "C")
## Make dna_segs with some alternate colors
dna_seg1 <- dna_seg(data.frame(name = names1,
start = (1:3) * 3,
end = (1:3) * 3 + 2,
strand = rep(1, 3)))
dna_seg2 <- dna_seg(data.frame(name = names2,
start = (1:3) * 3,
end = (1:3) * 3 + 2,
strand = rep(1, 3)))
dna_seg3 <- dna_seg(data.frame(name = names3,
start = (1:3) * 3,
end = (1:3) * 3 + 2,
strand = rep(1, 3)))
## Make comparisons
comp1 <- comparison(data.frame(start1 = c(3, 6, 9), end1 = c(5, 8, 11),
start2 = c(3, 9, 6), end2 = c(5, 11, 8),
name = c("A", "B", "C"),
direction = c(1, 1, 1)))
comp2 <- comparison(data.frame(start1 = c(3, 9, 6), end1 = c(5, 11, 8),
start2 = c(6, 3, 9), end2 = c(8, 5, 11),
name = c("A", "B", "C"),
direction = c(1, 1, 1)))
## Before adding a color scheme
plot_gene_map(dna_segs = list(dna_seg1, dna_seg2, dna_seg3),
comparisons = list(comp1, comp2),
alpha_comparisons = 0.6)
 ## Apply uniform color scheme
full_data <- uniform_color_scheme(list(dna_seg1, dna_seg2, dna_seg3),
comparisons = list(comp1, comp2),
id_column = "name")
plot_gene_map(dna_segs = full_data$dna_segs,
comparisons = full_data$comparisons,
alpha_comparisons = 0.6)
## Apply uniform color scheme
full_data <- uniform_color_scheme(list(dna_seg1, dna_seg2, dna_seg3),
comparisons = list(comp1, comp2),
id_column = "name")
plot_gene_map(dna_segs = full_data$dna_segs,
comparisons = full_data$comparisons,
alpha_comparisons = 0.6)
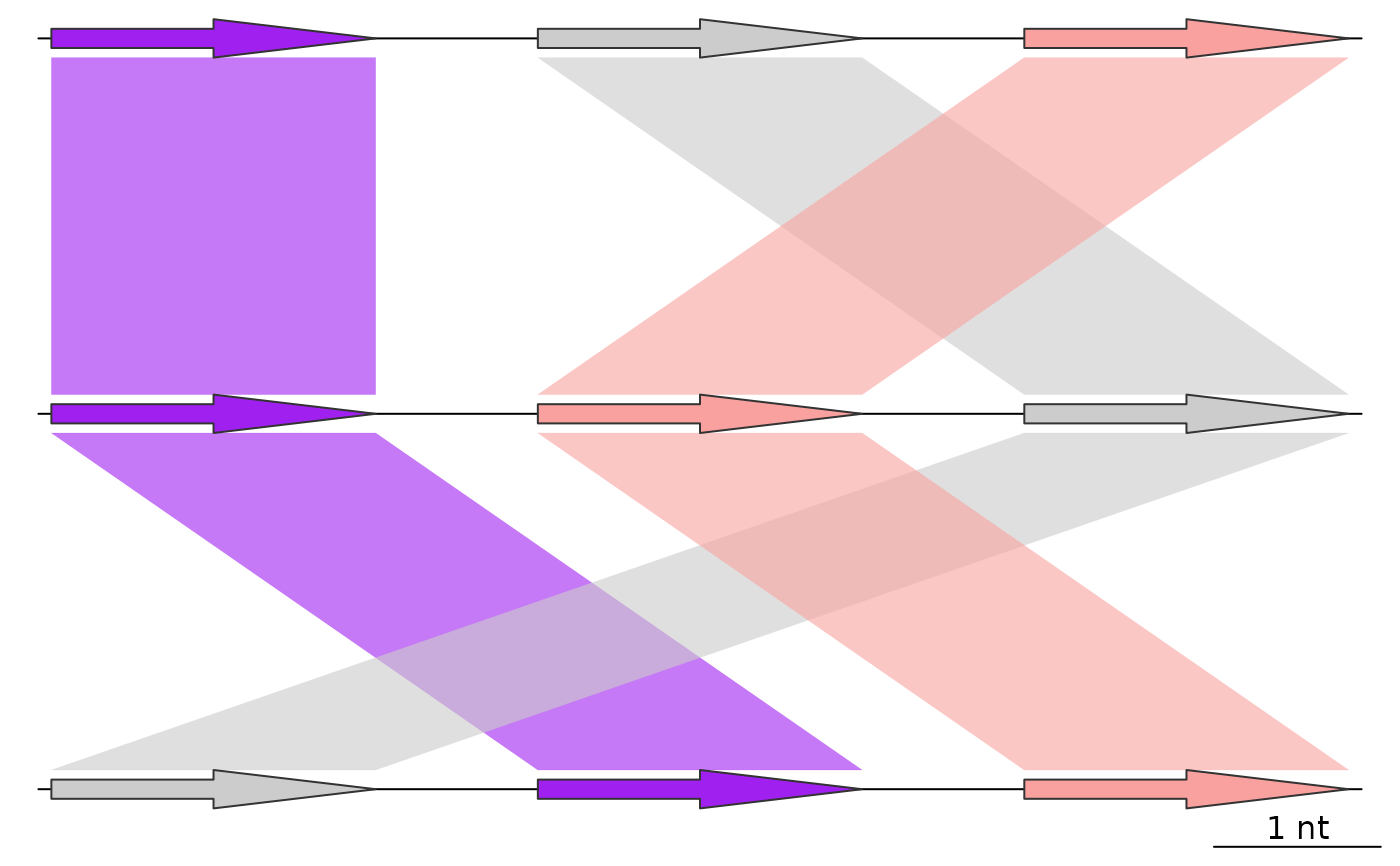
 ## Use ids and colors to specify the values and colors to use
full_data <- uniform_color_scheme(list(dna_seg1, dna_seg2, dna_seg3),
comparisons = list(comp1, comp2),
id_column = "name",
ids = c("A", "C"),
colors = c("purple", "#F8A19F"))
plot_gene_map(dna_segs = full_data$dna_segs,
comparisons = full_data$comparisons,
alpha_comparisons = 0.6)
## Use ids and colors to specify the values and colors to use
full_data <- uniform_color_scheme(list(dna_seg1, dna_seg2, dna_seg3),
comparisons = list(comp1, comp2),
id_column = "name",
ids = c("A", "C"),
colors = c("purple", "#F8A19F"))
plot_gene_map(dna_segs = full_data$dna_segs,
comparisons = full_data$comparisons,
alpha_comparisons = 0.6)