Apply a sequential color scheme to dna_segs and comparisons
sequential_color_scheme.RdGenerates and applies a sequential color scheme to a list of dna_seg and
comparison objects. It does this by taking the colors that are already
there and transferring those over to any features connected to it through
the comparisons. For example, if a feature from a single dna_seg has red
as its fill attribute, the comparisons that can be linked to this feature
will become red as well. This is then followed up by updating any dna_seg
features linked to those comparisons, and so on.
Usage
sequential_color_scheme(
  dna_segs,
  comparisons,
  seg_id = "locus_id",
  comparison_id = "auto",
  color_var = "fill",
  default_color = "grey80",
  both_directions = TRUE
)
Arguments
- dna_segs
A list of
dna_segobjects.- comparisons
A list of
comparisonobjects.- seg_id
The name of a
dna_segcolumn, whose values will be used to make the links to thecomparisons.- comparison_id
The shared name of the
comparisoncolumns, whose values will be used to make the links to thedna_segs. See details.- color_var
A character string denoting which color attribute to update for the
dna_segs, one of:"fill","col".- default_color
A character string providing a default color, must be either
NULLor a valid color. The color given by this argument will be ignored when updating, never overwriting any other color.- both_directions
Logical. If
FALSE, the color scheme will be applied sequentially in plotting order, starting from the firstdna_seg. Whenboth_directionsisTRUE, it will then additionally update eachdna_segandcomparisonin reverse plotting order.
Value
A list with 2 named elements: dna_segs and comparisons, which
are both lists containing the dna_seg and comparison objects,
respectively.
Details
The existing colors from the input dna_seg and
comparison objects are transferred over to the next object in the
plotting order, with the exception of their default colors, provided by
default_color. As comparison objects only have a single color
attribute col, those will be updated using the column provided by
color_var from the dna_segs, while the dna_segs themselves will be
updated using the col column from the comparisons regardless of
color_var.
The objects are linked together through shared
values. The columns for these shared values are determined by the seg_id
and comparison_id arguments, for the dna_segs and comparisons,
respectively. comparison_id refers to 2 columns, and defaults to "auto",
which will attempt to determine which columns to use automatically.
If for example, comparison_id is set as "name", it will look for the
"name1" and "name2" columns to match to the seg_id in the dna_segs
above, and under it, respectively.
Examples
## Prepare dna_seg
names1 <- c("1A", "1B", "1C")
names2 <- c("2A", "2C", "2B")
names3 <- c("3B", "3A", "3C")
## Make dna_segs with some alternate colors
dna_seg1 <- dna_seg(data.frame(name = names1,
start = (1:3) * 3,
end = (1:3) * 3 + 2,
strand = rep(1, 3),
fill = c("darkred", "grey80", "darkblue")))
dna_seg2 <- dna_seg(data.frame(name = names2,
start = (1:3) * 3,
end = (1:3) * 3 + 2,
strand = rep(1, 3),
fill = c("grey80", "grey80", "darkgreen")))
dna_seg3 <- dna_seg(data.frame(name = names3,
start = (1:3) * 3,
end = (1:3) * 3 + 2,
strand = rep(1, 3)))
## Make comparisons
comp1 <- comparison(data.frame(start1 = c(3, 6, 9), end1 = c(5, 8, 11),
start2 = c(3, 9, 6), end2 = c(5, 11, 8),
name1 = c("1A", "1B", "1C"),
name2 = c("2A", "2B", "2C"),
direction = c(1, 1, 1)))
comp2 <- comparison(data.frame(start1 = c(3, 9, 6), end1 = c(5, 11, 8),
start2 = c(6, 3, 9), end2 = c(8, 5, 11),
name1 = c("2A", "2B", "2C"),
name2 = c("3A", "3B", "3C"),
direction = c(1, 1, 1)))
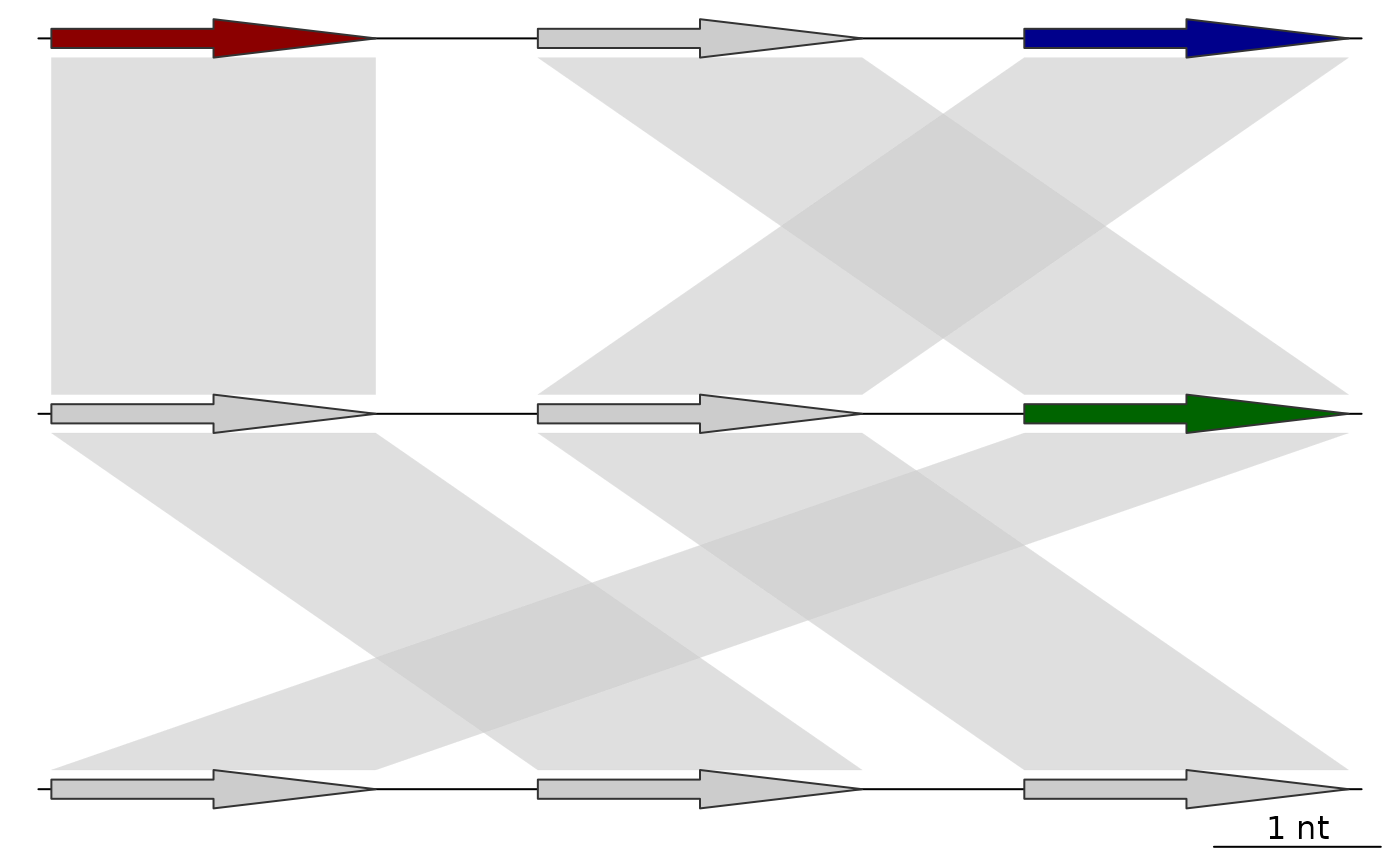
## Before adding a color scheme
plot_gene_map(dna_segs = list(dna_seg1, dna_seg2, dna_seg3),
comparisons = list(comp1, comp2),
alpha_comparisons = 0.6)
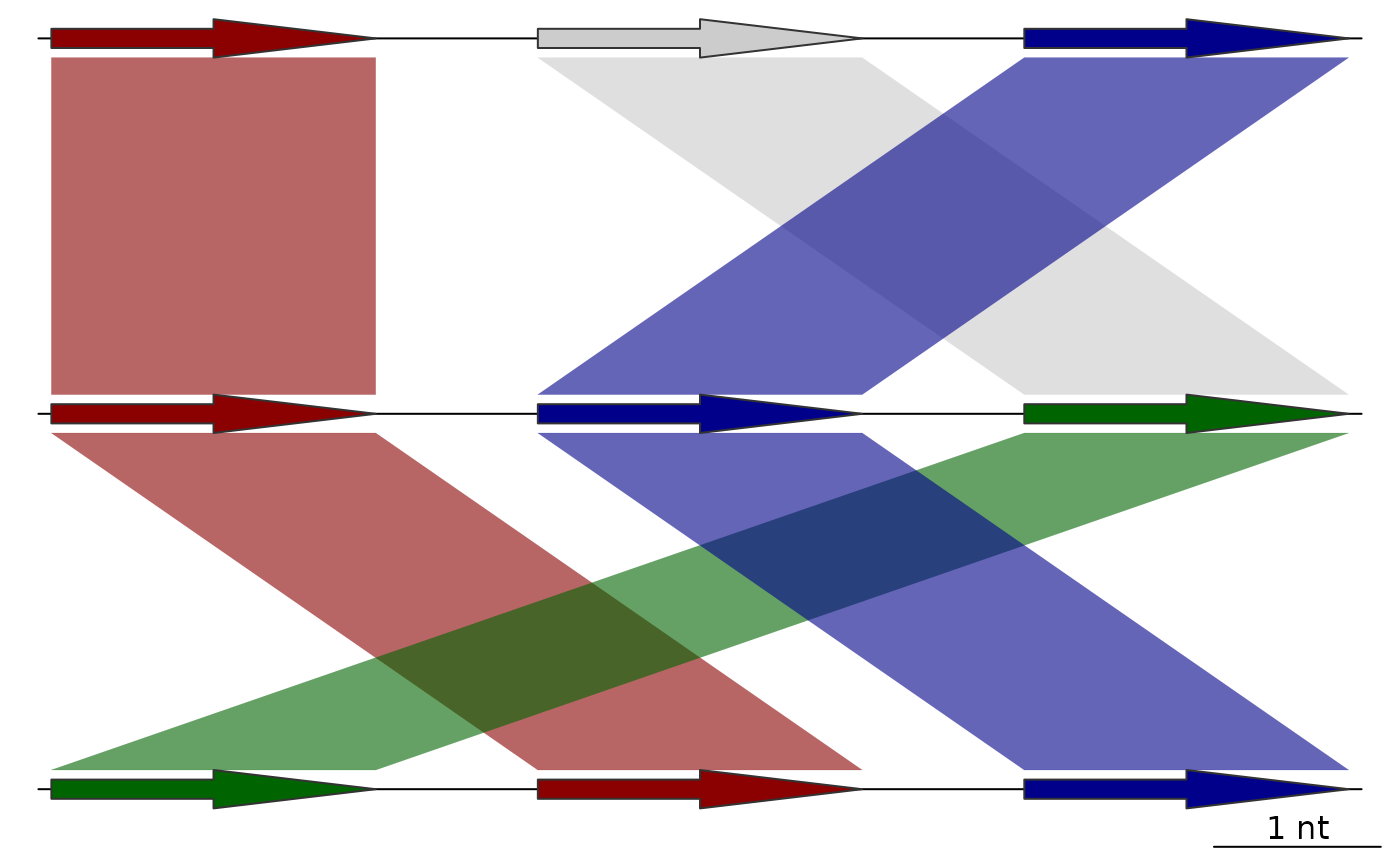
 ## Sequential color scheme without going both directions
full_data <- sequential_color_scheme(list(dna_seg1, dna_seg2, dna_seg3),
comparisons = list(comp1, comp2),
seg_id = "name",
both_directions = FALSE)
plot_gene_map(dna_segs = full_data$dna_segs,
comparisons = full_data$comparisons,
alpha_comparisons = 0.6)
## Sequential color scheme without going both directions
full_data <- sequential_color_scheme(list(dna_seg1, dna_seg2, dna_seg3),
comparisons = list(comp1, comp2),
seg_id = "name",
both_directions = FALSE)
plot_gene_map(dna_segs = full_data$dna_segs,
comparisons = full_data$comparisons,
alpha_comparisons = 0.6)
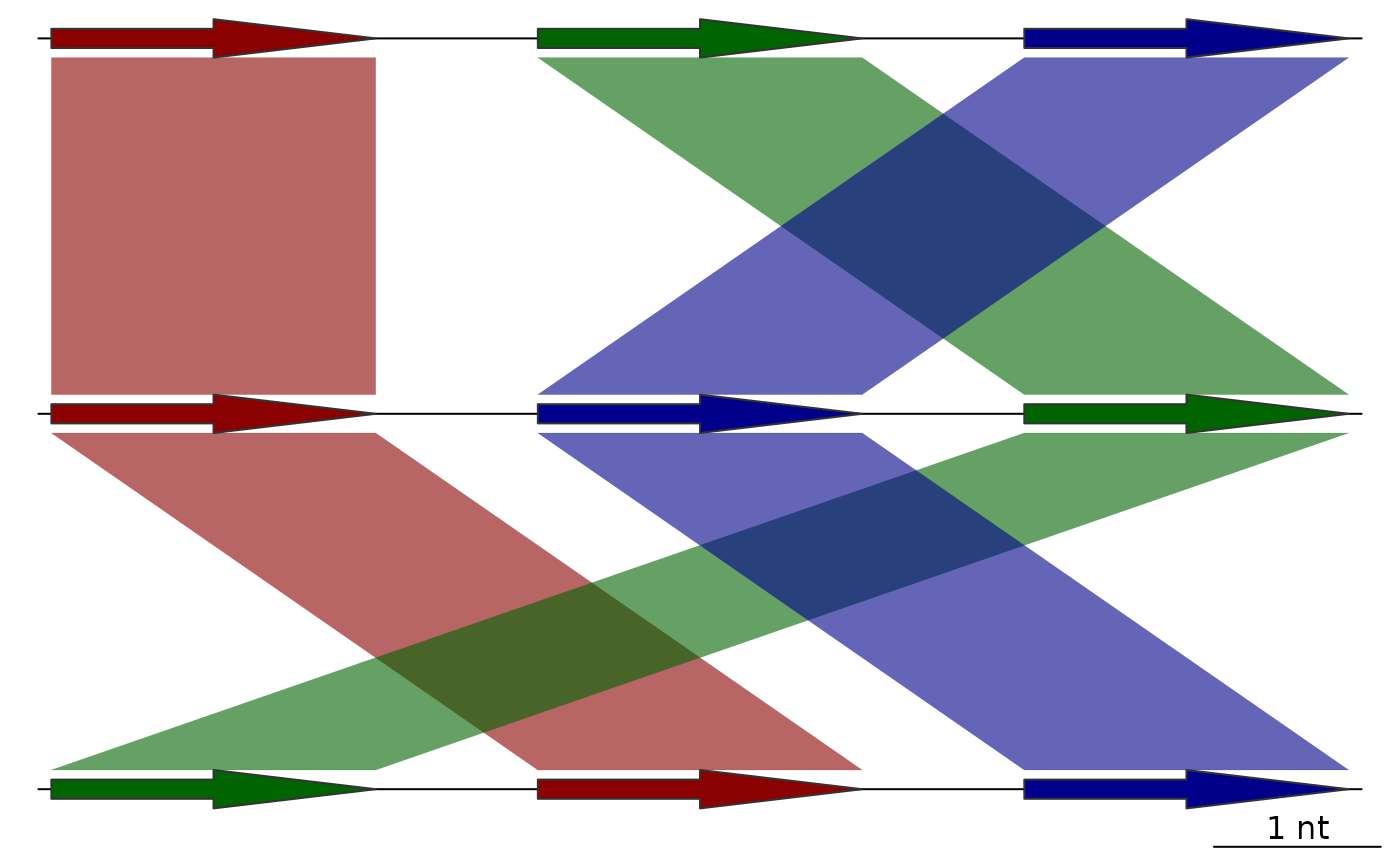
 ## Sequential color scheme with both directions
full_data <- sequential_color_scheme(list(dna_seg1, dna_seg2, dna_seg3),
comparisons = list(comp1, comp2),
seg_id = "name")
plot_gene_map(dna_segs = full_data$dna_segs,
comparisons = full_data$comparisons,
alpha_comparisons = 0.6)
## Sequential color scheme with both directions
full_data <- sequential_color_scheme(list(dna_seg1, dna_seg2, dna_seg3),
comparisons = list(comp1, comp2),
seg_id = "name")
plot_gene_map(dna_segs = full_data$dna_segs,
comparisons = full_data$comparisons,
alpha_comparisons = 0.6)